8/29/2016 - Extreme Trader Positions Now More Compelling
US Stocks, Dollar, Gold, Silver, Emerging Market Stocks and Bonds, and Crude Oil.
Dear Participants,
Please note the attached sheet which has, among other charts, 4 US stock index futures charts with CFTC Commitment of Trader's reported positions as of last Tuesday.
U.S. Stocks.
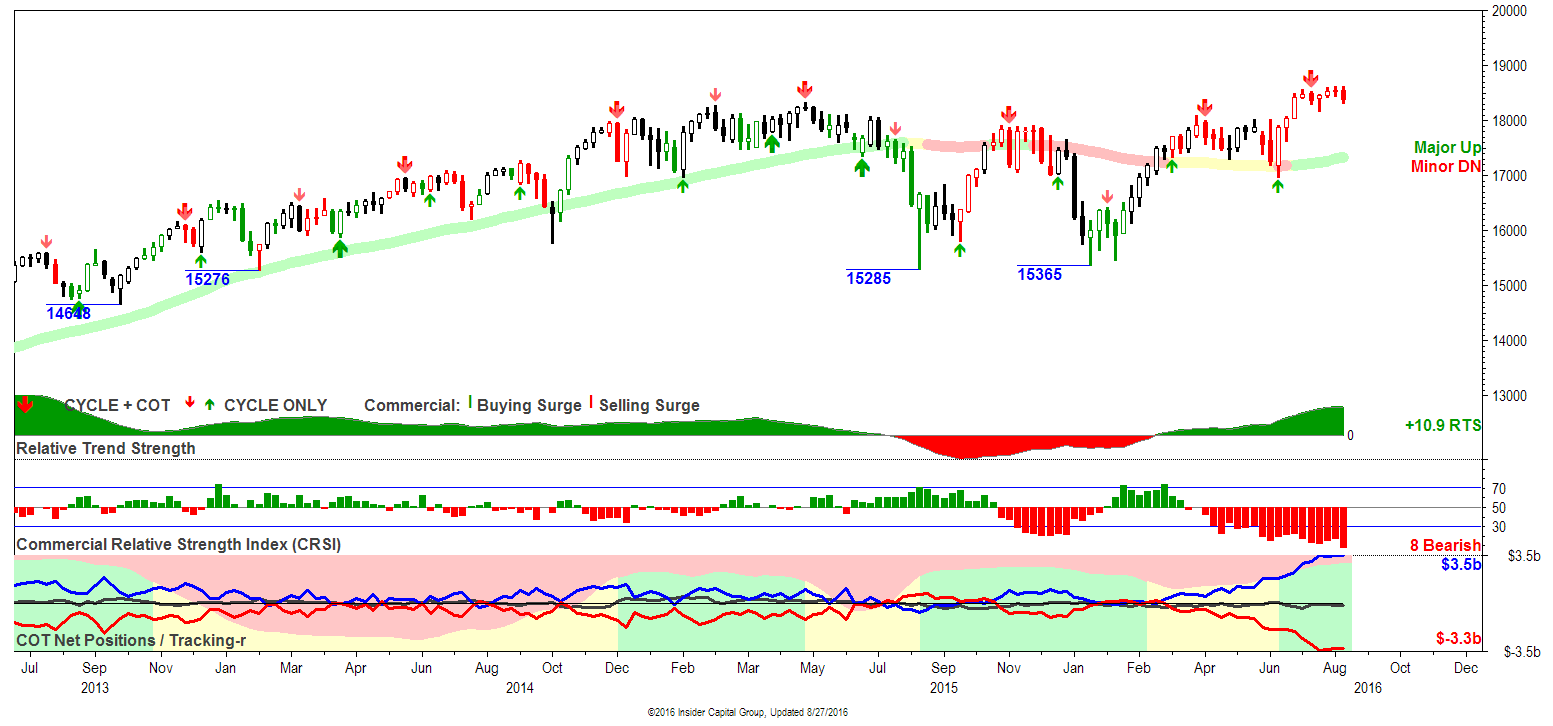
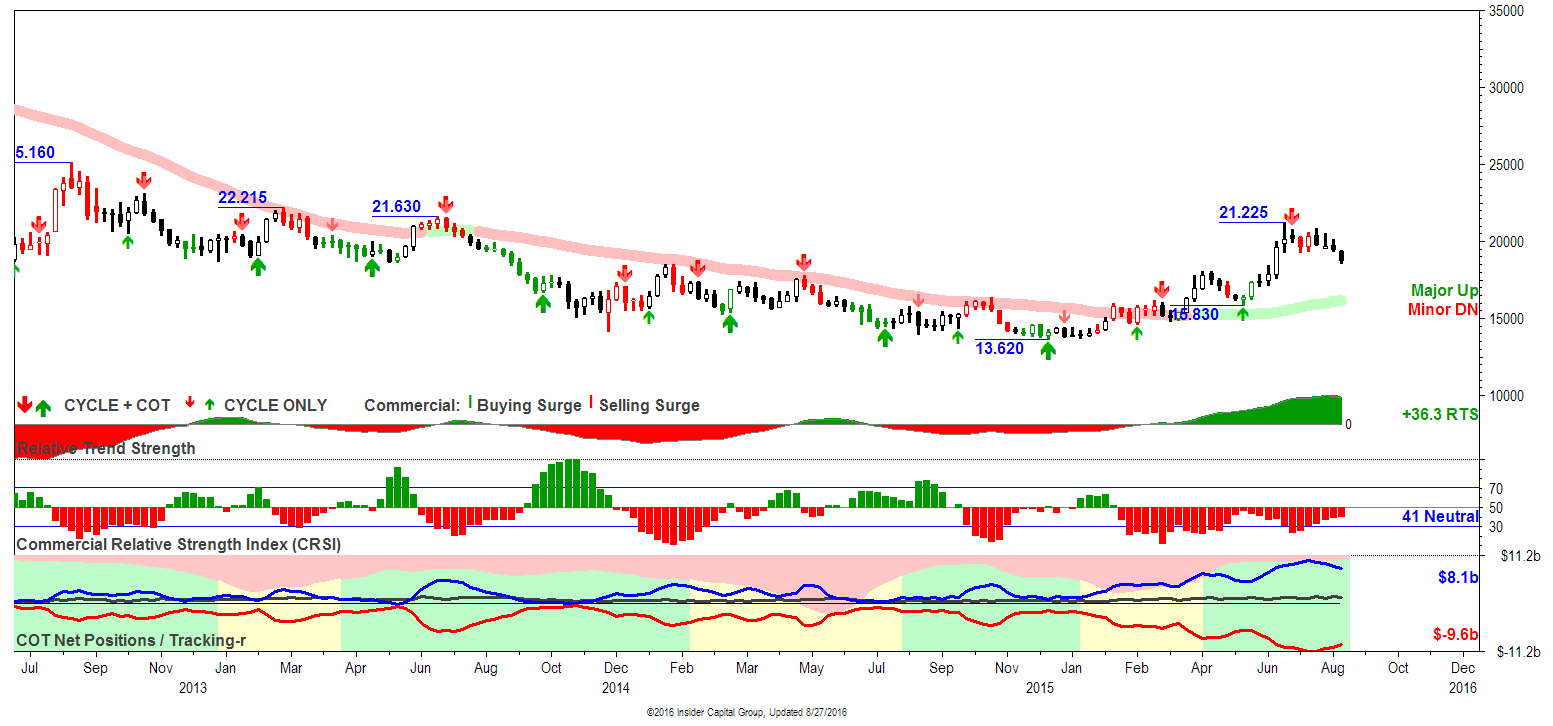
Now all three major large cap stock futures indexes support extreme spreads between Short Commercial Insiders and Long Fund Trend Followers. [NOTICE in the top 3 graphs the bottom portion of each graph entitled: COT Net Positions / Tracking; large funds net positions are represented by the blue line; large commercial net positions are represented by the red line, and all others ' (deemed to be small speculators) net positions are represented by the black line.] This type of trader configuration often marks the end of the preceding trend or at least a pause in it. That being said, we have yet to see a blow-off top in US Stock, and unless and until that happens, there can be no assurance it won't. If and when it does, it will be safe to be mostly in cash and over-hedged in stock positions.
Although the US Small Cap Russell 2000 futures index doesn't seem to be as extreme from a net positions perspective, notice that large funds don't often get extremely net long. We are currently at their highest net position shown on the cart and they/funds set an ALL-TIME long-only position. Hence, we view all 4 indexes as being in a currently bearish configurations. With new sell signals in S&P 500 Futures and NASDAQ Futures, and a 3 week old sell signal in Dow E-Mini Future, and a very weak seasonal period ahead for all of September and part of October, we grade risk in US stocks at this point to be very high.
Accordingly, this is a time to consider a meaningful amount of cash (US T-Bill MM account) and to at least be partially hedged in your long stock positions with Inverse Stock Funds.
If we were forced to opine, we'd likely say that there's a 60% chance we'll have a meaningful fear inducing correction (to bottom in October) to set the stage for a final year-end (a seasonally strong period) rally and potentially accompanying blow off top. On the other hand, the extremes we see in trader positions is sufficient to have meaningful concern that we turn down in earnest from here. We will see.
US Dollar
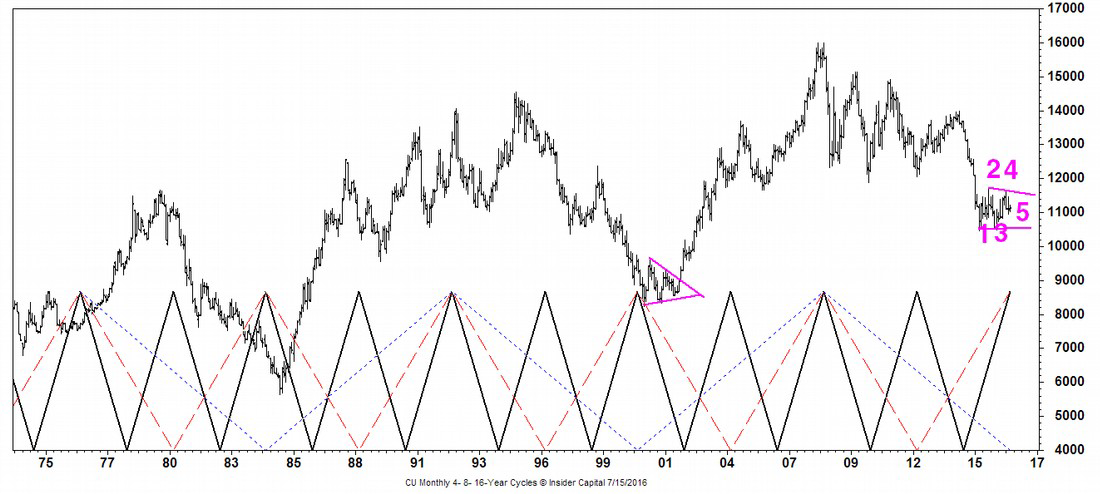
Also of important notice is what APPEARS to be happening in the US Dollar market. Just this past Friday, the US Dollar had an BULLISH OUTSIDE UP DAY and the Euro had a BEARISH OUTSIDE DOWN DAY. This on the back of Janet Yellen, Fed Chairman's very hawkish speech (only on dovish dialogue that had to do with tools FUTURE policymakers MIGHT consider). This may be the kick off of a final dollar rally to new highs. This would be bearish all commodities, and would set the stage for exceptional buying opportunities in contra-dollar assets ONCE THE DOLLAR PEAKS (assuming it has not already). Although the Dollar is overdue to complete its 16-year (Peak to Trough to Peak) Cycle in this year (was supposed to be Summer, so perhaps the top is in). The pattern in the dollar chart suggests that since the March 2015 dollar top, the Dollar has been in counter-trend triangle pattern. That potential 4th wave triangular pattern could be considered complete, setting the stage for a final dollar Rally above 101, now at 95.69.
Precious Metals
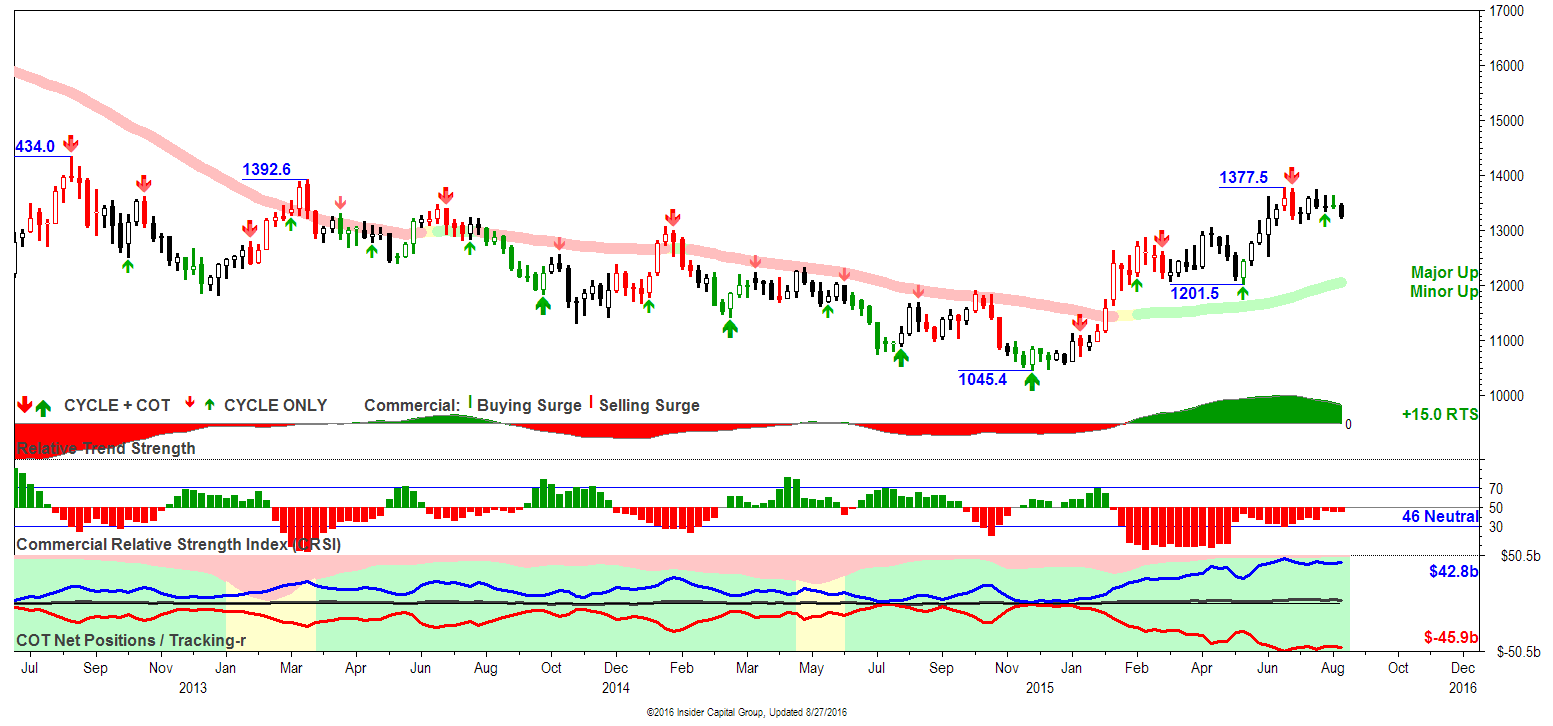
If Dollar plays out as expected, it would co-inside with what commercial positions are telling us in Gold and Silver markets, which sport inverse correlations to the dollar. Note that in those charts the extreme trader positions indicating a lot of risk to longs. However, the trend is up and relative strength is strong. However, that is often the case before a downturn.
Emerging Market Stocks
Although valuations are superior to substantially overpriced US stock markets, if the dollar is turning up, and there is some follow-through at this point so far today, it is difficult to imagine Emerging Markets continuing to rally strongly. Here's what the Bank of International Settlements had to say about this last December.
Dollar bonds issued by EME non-banks' offshore affiliates have surged over the past six years, as have dollar bank loans obtained by non-banks within the home country. Since high overall dollar debt can leave borrowers vulnerable to rising dollar yields and dollar appreciation, dollar debt aggregates bear watching. Standard measures of residents' external debt do not include bonds issued by affiliates outside the home country or dollar bank debt incurred in the home country. Multinational firms' balance sheets are not neatly confined within national borders, and the domestic currency may not account for all domestic intermediation (Avdjiev et al (2015)), so a dollar debt measure that looks beyond and within national borders can indicate vulnerabilities missed by external debt measures.
Therefore, taking some money off the table in EMs may make some sense at this point. EMs will likely experience their first meaningful retracement of their first leg up once US Stock markets experience their first leg down. That would set up a great time to add meaningfully to those positions.
Energy
Commodities, such as Oil and Gas tend to have inverse correlations to the US Dollar as well. Hence, their are meaningful market indicators that suggest the potential for a final leg down in liquid hydrocarbons.
CRUDE OIL: The two large trader groups both produced weekly trading surges, funds buying totaling $2.2b and commercials selling 2.6b. This placed total commercial sales at the 76 percentile and fund buys at the 95 percentile of historic weekly totals, and...*A new COT sell signal was posted along with a trading cycle high. *Funds hold a near-record long oly position extreme, creating huge long liquidation risk. This week's price action formed an inside bar, adding to potential trader interest in next week's price trend.
Because of the rapid decline in oil prices, Saudi Arabia – one of the largest oil-producing members of OPEC – says it will once again talk about cutting production. And Iran says it might even attend the OPEC meeting this time...
We already know how this story will end, though.
We've seen this story play out twice already this year... back in February, when Saudi Arabia first announced talks of a production freeze... and again in April, when the OPEC countries met in Qatar and came away with nothing.
The same thing will happen this time because of one key factor: Iran is still a member of OPEC. As we've told you before, the relationship between Saudi Arabia and Iran is terrible, and Iran isn't about to agree to restrict oil production right now after 35 years of sanctions.
So even if the Iranians attend the meeting (they bailed out of the last one), the oil-supply situation isn't going to change.
Remember, this is all about market share. Saudi Arabia wants to keep the Asian markets to itself. It is competing with cheap oil from Russia. It's also troubled by new production coming from post-sanction Iran.
So Saudi Arabia opened its spigots all the way. It produced close to 11 million barrels per day in July... and then talked about freezing production. In other words, it produced as much oil as it could before saying, "We won't go any further."
Saudi Arabia produced a huge volume of oil last month... and it offset a lot of the production decline in the U.S. That's part of the reason why oil prices fell recently.
Oil prices are going to move like this for the next few months. We're in for a rough ride. Until Saudi Arabia, Russia, Iran, and the rest of OPEC quit flooding the market with oil, volatility is here to stay.
While production declines in the US are bullish, the Baker Hughes jump in Rig Count suggest that decline may reverse or at least moderate. That viewed in connection with global political situation and the large long fund position in futures and options suggest that there is still quite a bit of risk on the downside in oil.
If and until we see some selling capitulation in Fund long positions, there may still be more risk to the downside in oil.
Click for more information on this topic.
S&P500 Futures

NASDAQ Futures
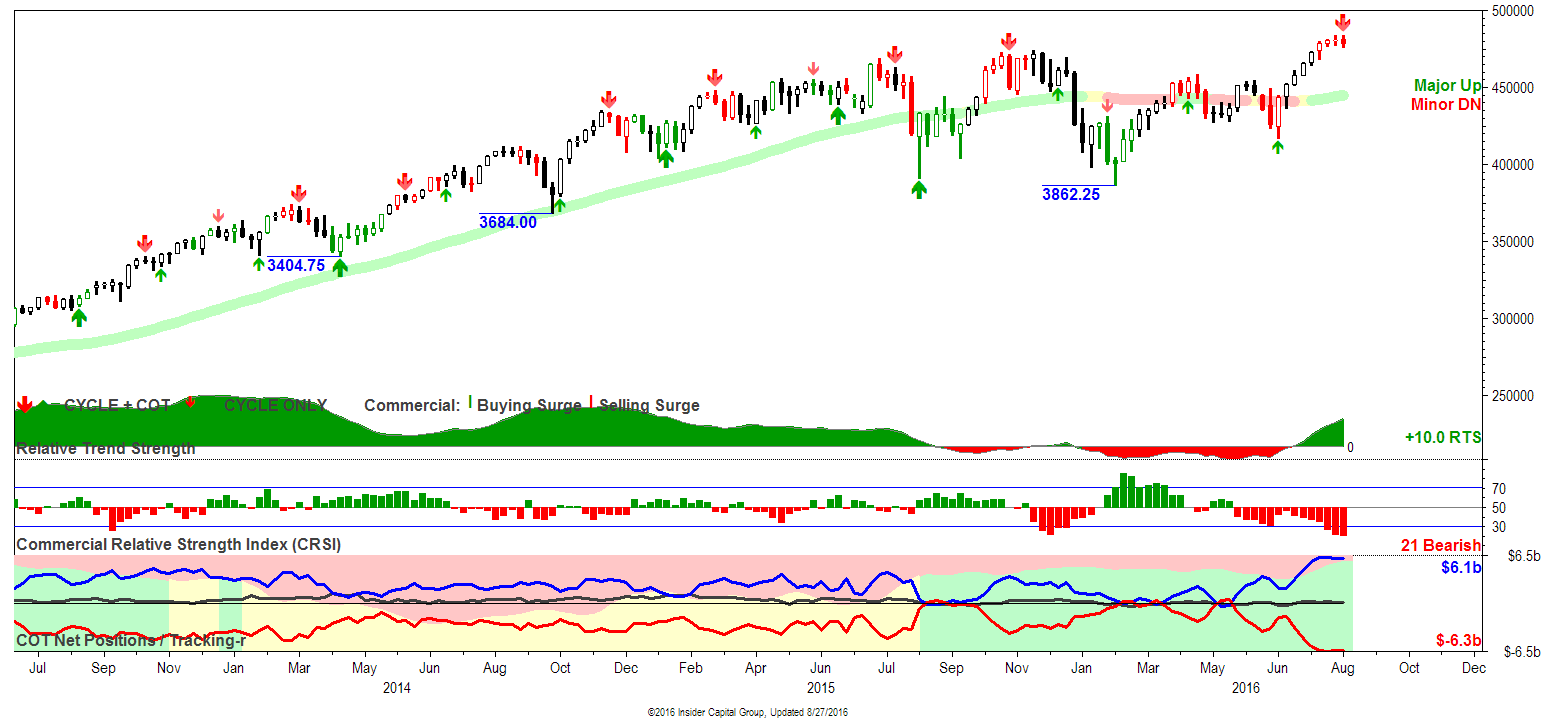
NASDAQ E-MINI: Commercials were net sellers on an up week through Tuesday's COT tabulation, and...*A new COT sell signal was posted along with a trading cycle high. A move above 4836.75 this week would cancel the COT signal arrow. *The fund near-record notional extreme with a similar commercial net short total creates conditions ripe for a significant pullback. A technical weekly bearish reversal bar was posted, favoring a downside follow-through this week.
Dow E-Mini Futures
Russell 2000 Futures
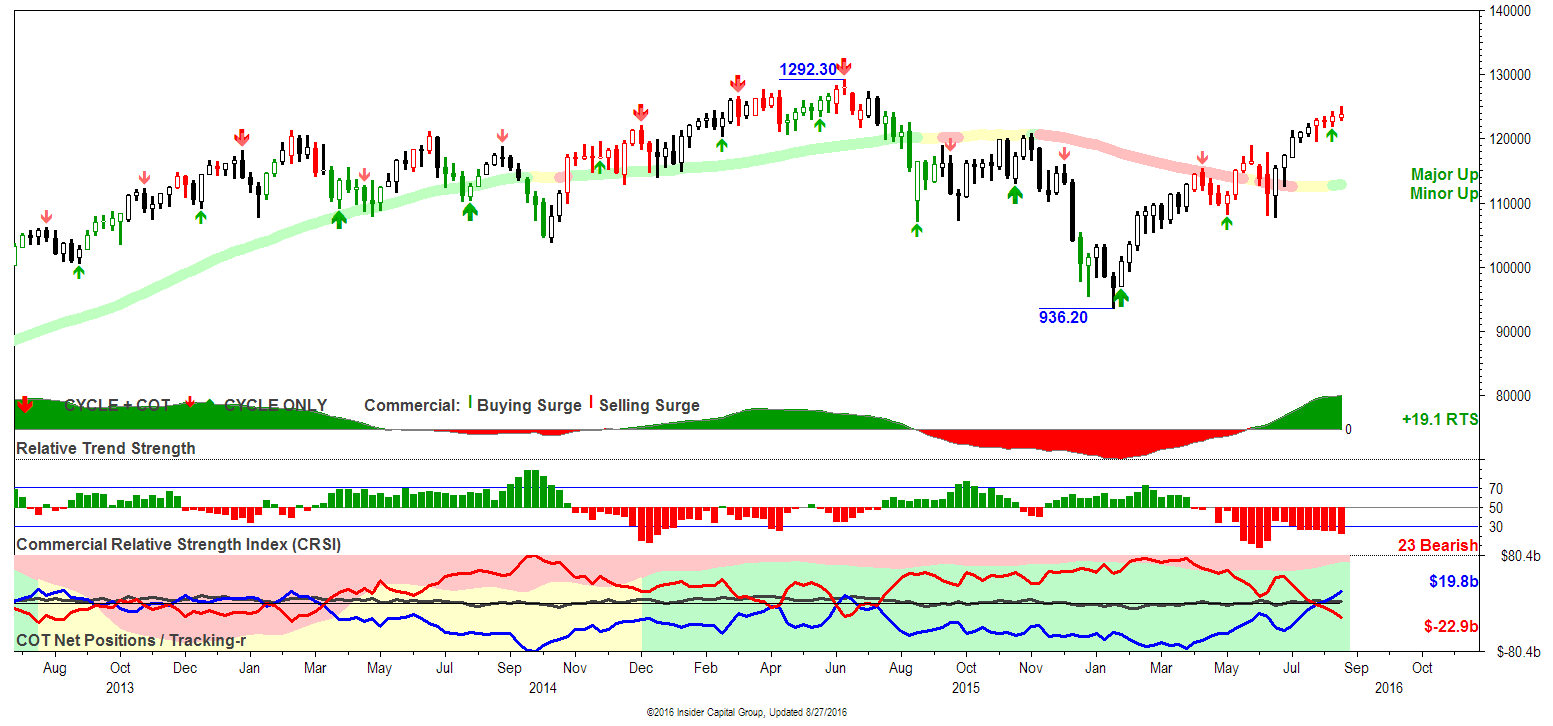
RUSSELL 2000: Commercial selling surged $67.8b in futures and options over the past seven weeks, marked by four consecutive red price bars. The most recent COT signal was a buy several months ago, which is now expired. *Funds set an all-time record long-only position, suggesting high risk of an eminent upside reversal. Technicals are bullish, with a positive RTS corroborating minor and major bull trends. COT sell signals in other sector markets apply here
Gold Futures
Silver Futures
Crude Oil
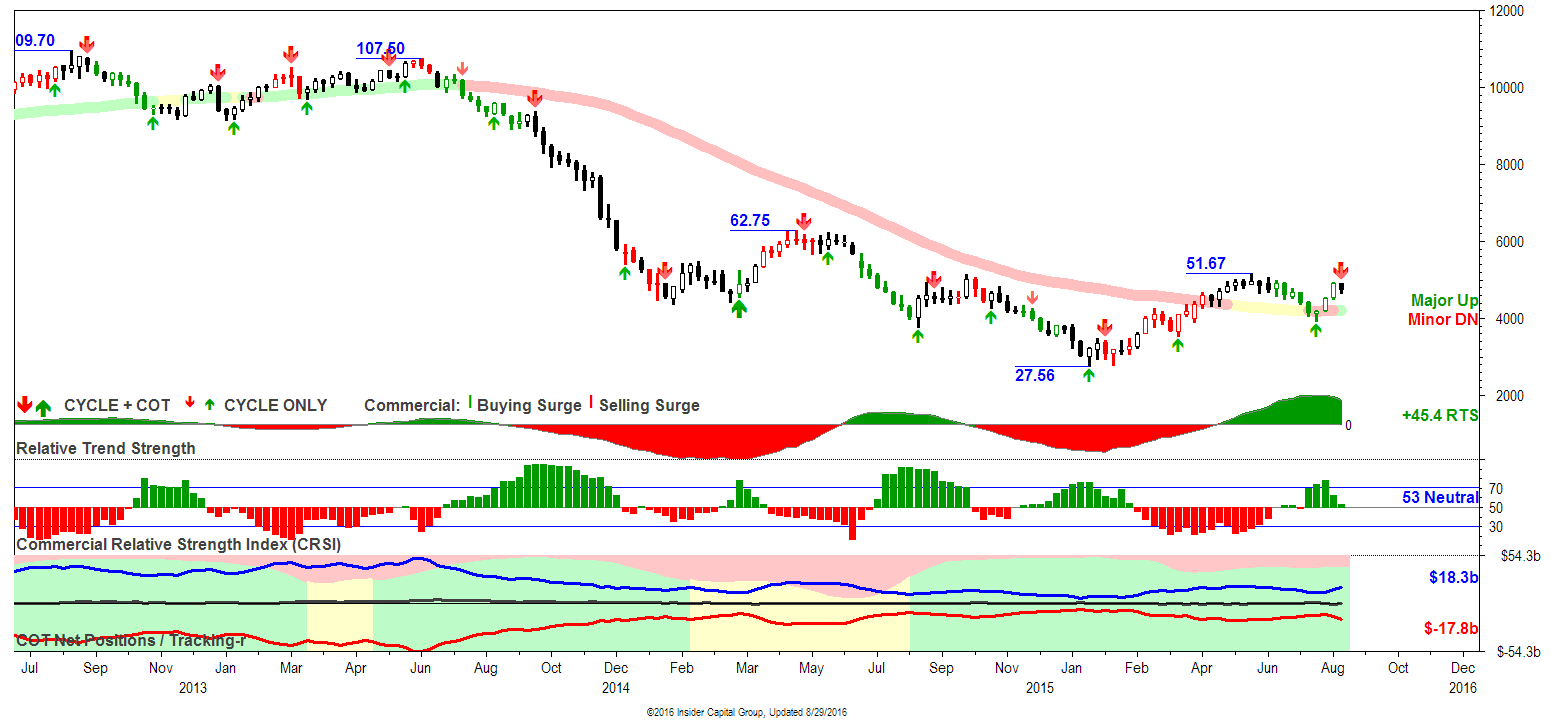
CRUDE OIL: The two large trader groups both produced weekly trading surges, funds buying totaling $2.2b and commercials selling 2.6b. This placed total commercial sales at the 76 percentile and fund buys at the 95 percentile of historic weekly totals, and...*A new COT sell signal was posted along with a trading cycle high. *Funds hold a near-record long oly position extreme, creating huge long lquidation risk. This week's price action formed an inside bar, adding to potential trader interest in next week's price trend.
EUR/USD 4, 8, and 16 year cycles chart:
DISCLAIMER:
This is a Market Alert and Potential Investment Opportunity notice. It does NOT constitute investment advice, which can only be provided in the context of full knowledge of an individual client's financial position and goals. Hence, this notice, and all such notices (whether or not this disclaimer is provided) should be considered by the participant in connection with advice from their own investment advisors.
Our obligation to the plan is to maintain sufficient investment options so that participants can manage risk and capitalize on opportunities. This free notice service is beyond our contractual duties to the plan and is provided as a supplemental service which participants are free to accept or reject.
Thank you for your attention to this notice. We greatly appreciate your trust and confidence in us and wish you and all of the participants the best in achieving your retirement objectives.

